> ## Documentation Index
> Fetch the complete documentation index at: https://docs.captrid.com/llms.txt
> Use this file to discover all available pages before exploring further.
# Analytics
> View session performance, staff activity, submission trends, and compare sessions side by side.
The Analytics screen gives you detailed metrics across your organisation. Open it from the sidebar or from the Dashboard's quick actions.
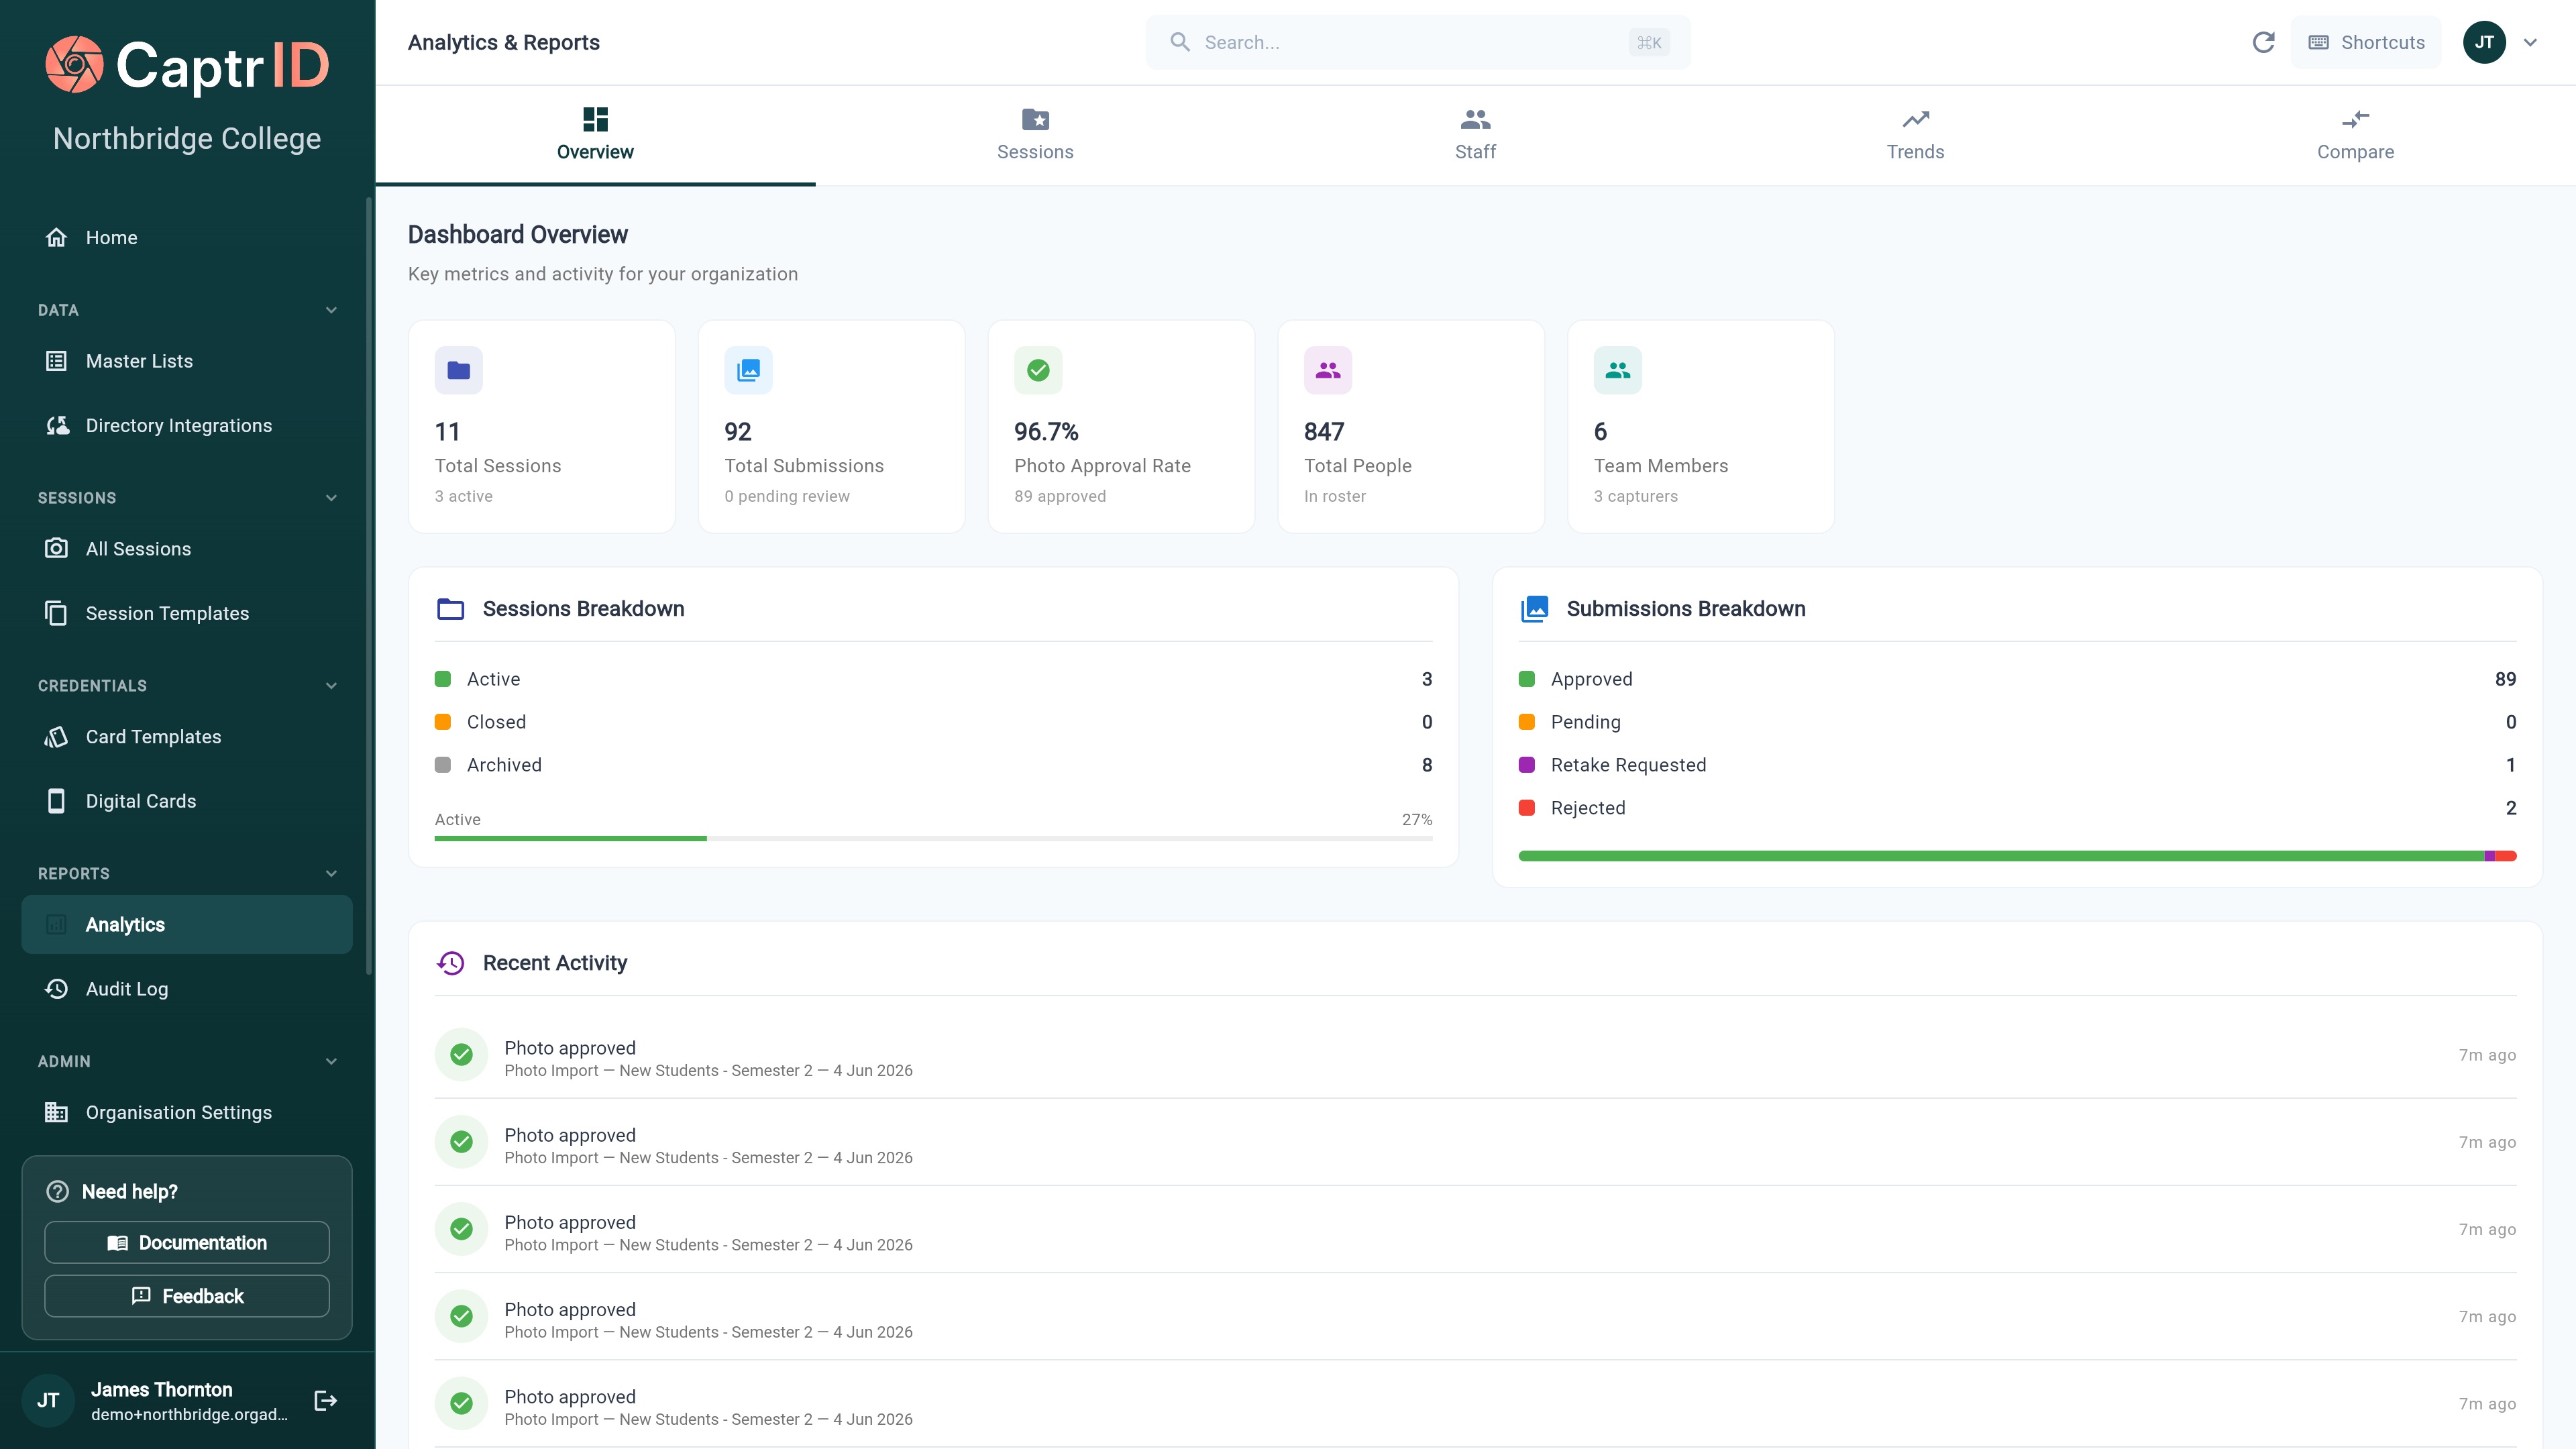
## Overview tab
The Overview tab shows organisation-wide summary cards:
 | Metric | What it shows |
| ----------------------------------------------- | ---------------------------------- |
| **Total / Active / Closed / Archived Sessions** | Session counts by status |
| **Total People** | People across all sessions |
| **Total Submissions** | All photo submissions |
| **Pending / Approved / Rejected / Retake** | Submission counts by status |
| **Approval Rate** | Percentage of submissions approved |
| **Admin Count / Capturer Count** | Team size breakdown |
Below the summary cards, you'll see:
* **Sessions breakdown** — session counts by lifecycle stage
* **Submissions breakdown** — photo counts by status
* **Recent activity** — the last 20 submissions with status, session name, and timestamp
## Sessions tab
Per-session performance cards showing:
* Session name and status (Active, Closed, or Archived)
* **Roster size** — total people in the session
* **Completion %** — percentage of people with approved photos
* **Photo approval %** — percentage of submissions approved
* Status chips for approved, pending, rejected, and retake counts
* Progress bar showing completion at a glance
Sessions are sorted by most recent first.
## Staff tab
A table showing each team member's contributions:
| Column | What it shows |
| --------------- | -------------------------------------------- |
| **Team Member** | Name, email, and avatar |
| **Role** | Organisation Admin, Coordinator, or Capturer |
| **Captured** | Number of photos submitted |
| **Reviewed** | Number of photos approved or rejected |
| **Total** | Combined actions |
Sorted by total activity, highest first.
## Trends tab
Track submission volume over time:
| Metric | What it shows |
| ----------------------------------------------- | ---------------------------------- |
| **Total / Active / Closed / Archived Sessions** | Session counts by status |
| **Total People** | People across all sessions |
| **Total Submissions** | All photo submissions |
| **Pending / Approved / Rejected / Retake** | Submission counts by status |
| **Approval Rate** | Percentage of submissions approved |
| **Admin Count / Capturer Count** | Team size breakdown |
Below the summary cards, you'll see:
* **Sessions breakdown** — session counts by lifecycle stage
* **Submissions breakdown** — photo counts by status
* **Recent activity** — the last 20 submissions with status, session name, and timestamp
## Sessions tab
Per-session performance cards showing:
* Session name and status (Active, Closed, or Archived)
* **Roster size** — total people in the session
* **Completion %** — percentage of people with approved photos
* **Photo approval %** — percentage of submissions approved
* Status chips for approved, pending, rejected, and retake counts
* Progress bar showing completion at a glance
Sessions are sorted by most recent first.
## Staff tab
A table showing each team member's contributions:
| Column | What it shows |
| --------------- | -------------------------------------------- |
| **Team Member** | Name, email, and avatar |
| **Role** | Organisation Admin, Coordinator, or Capturer |
| **Captured** | Number of photos submitted |
| **Reviewed** | Number of photos approved or rejected |
| **Total** | Combined actions |
Sorted by total activity, highest first.
## Trends tab
Track submission volume over time:
 1. Select a **time range** — Last 7 days, 30 days, or 90 days
2. View the **daily submissions chart** showing how many photos were submitted each day
3. Check the **trend statistics**:
* Total submissions in the period
* Daily average
* Peak day (highest single-day count)
* Active days (days with at least one submission)
## Compare Sessions tab
Compare two or more sessions side by side:
1. Select the sessions you want to compare
2. View their stats in a comparison table — roster size, completion rate, approval rate, and submission counts
This is useful for tracking improvement across photo days or comparing different capture approaches.
## What's next?
Return to your home screen for a quick overview.
Export session data as CSV, ZIP, or PDF.
1. Select a **time range** — Last 7 days, 30 days, or 90 days
2. View the **daily submissions chart** showing how many photos were submitted each day
3. Check the **trend statistics**:
* Total submissions in the period
* Daily average
* Peak day (highest single-day count)
* Active days (days with at least one submission)
## Compare Sessions tab
Compare two or more sessions side by side:
1. Select the sessions you want to compare
2. View their stats in a comparison table — roster size, completion rate, approval rate, and submission counts
This is useful for tracking improvement across photo days or comparing different capture approaches.
## What's next?
Return to your home screen for a quick overview.
Export session data as CSV, ZIP, or PDF.