Overview tab
The Overview tab shows organisation-wide summary cards: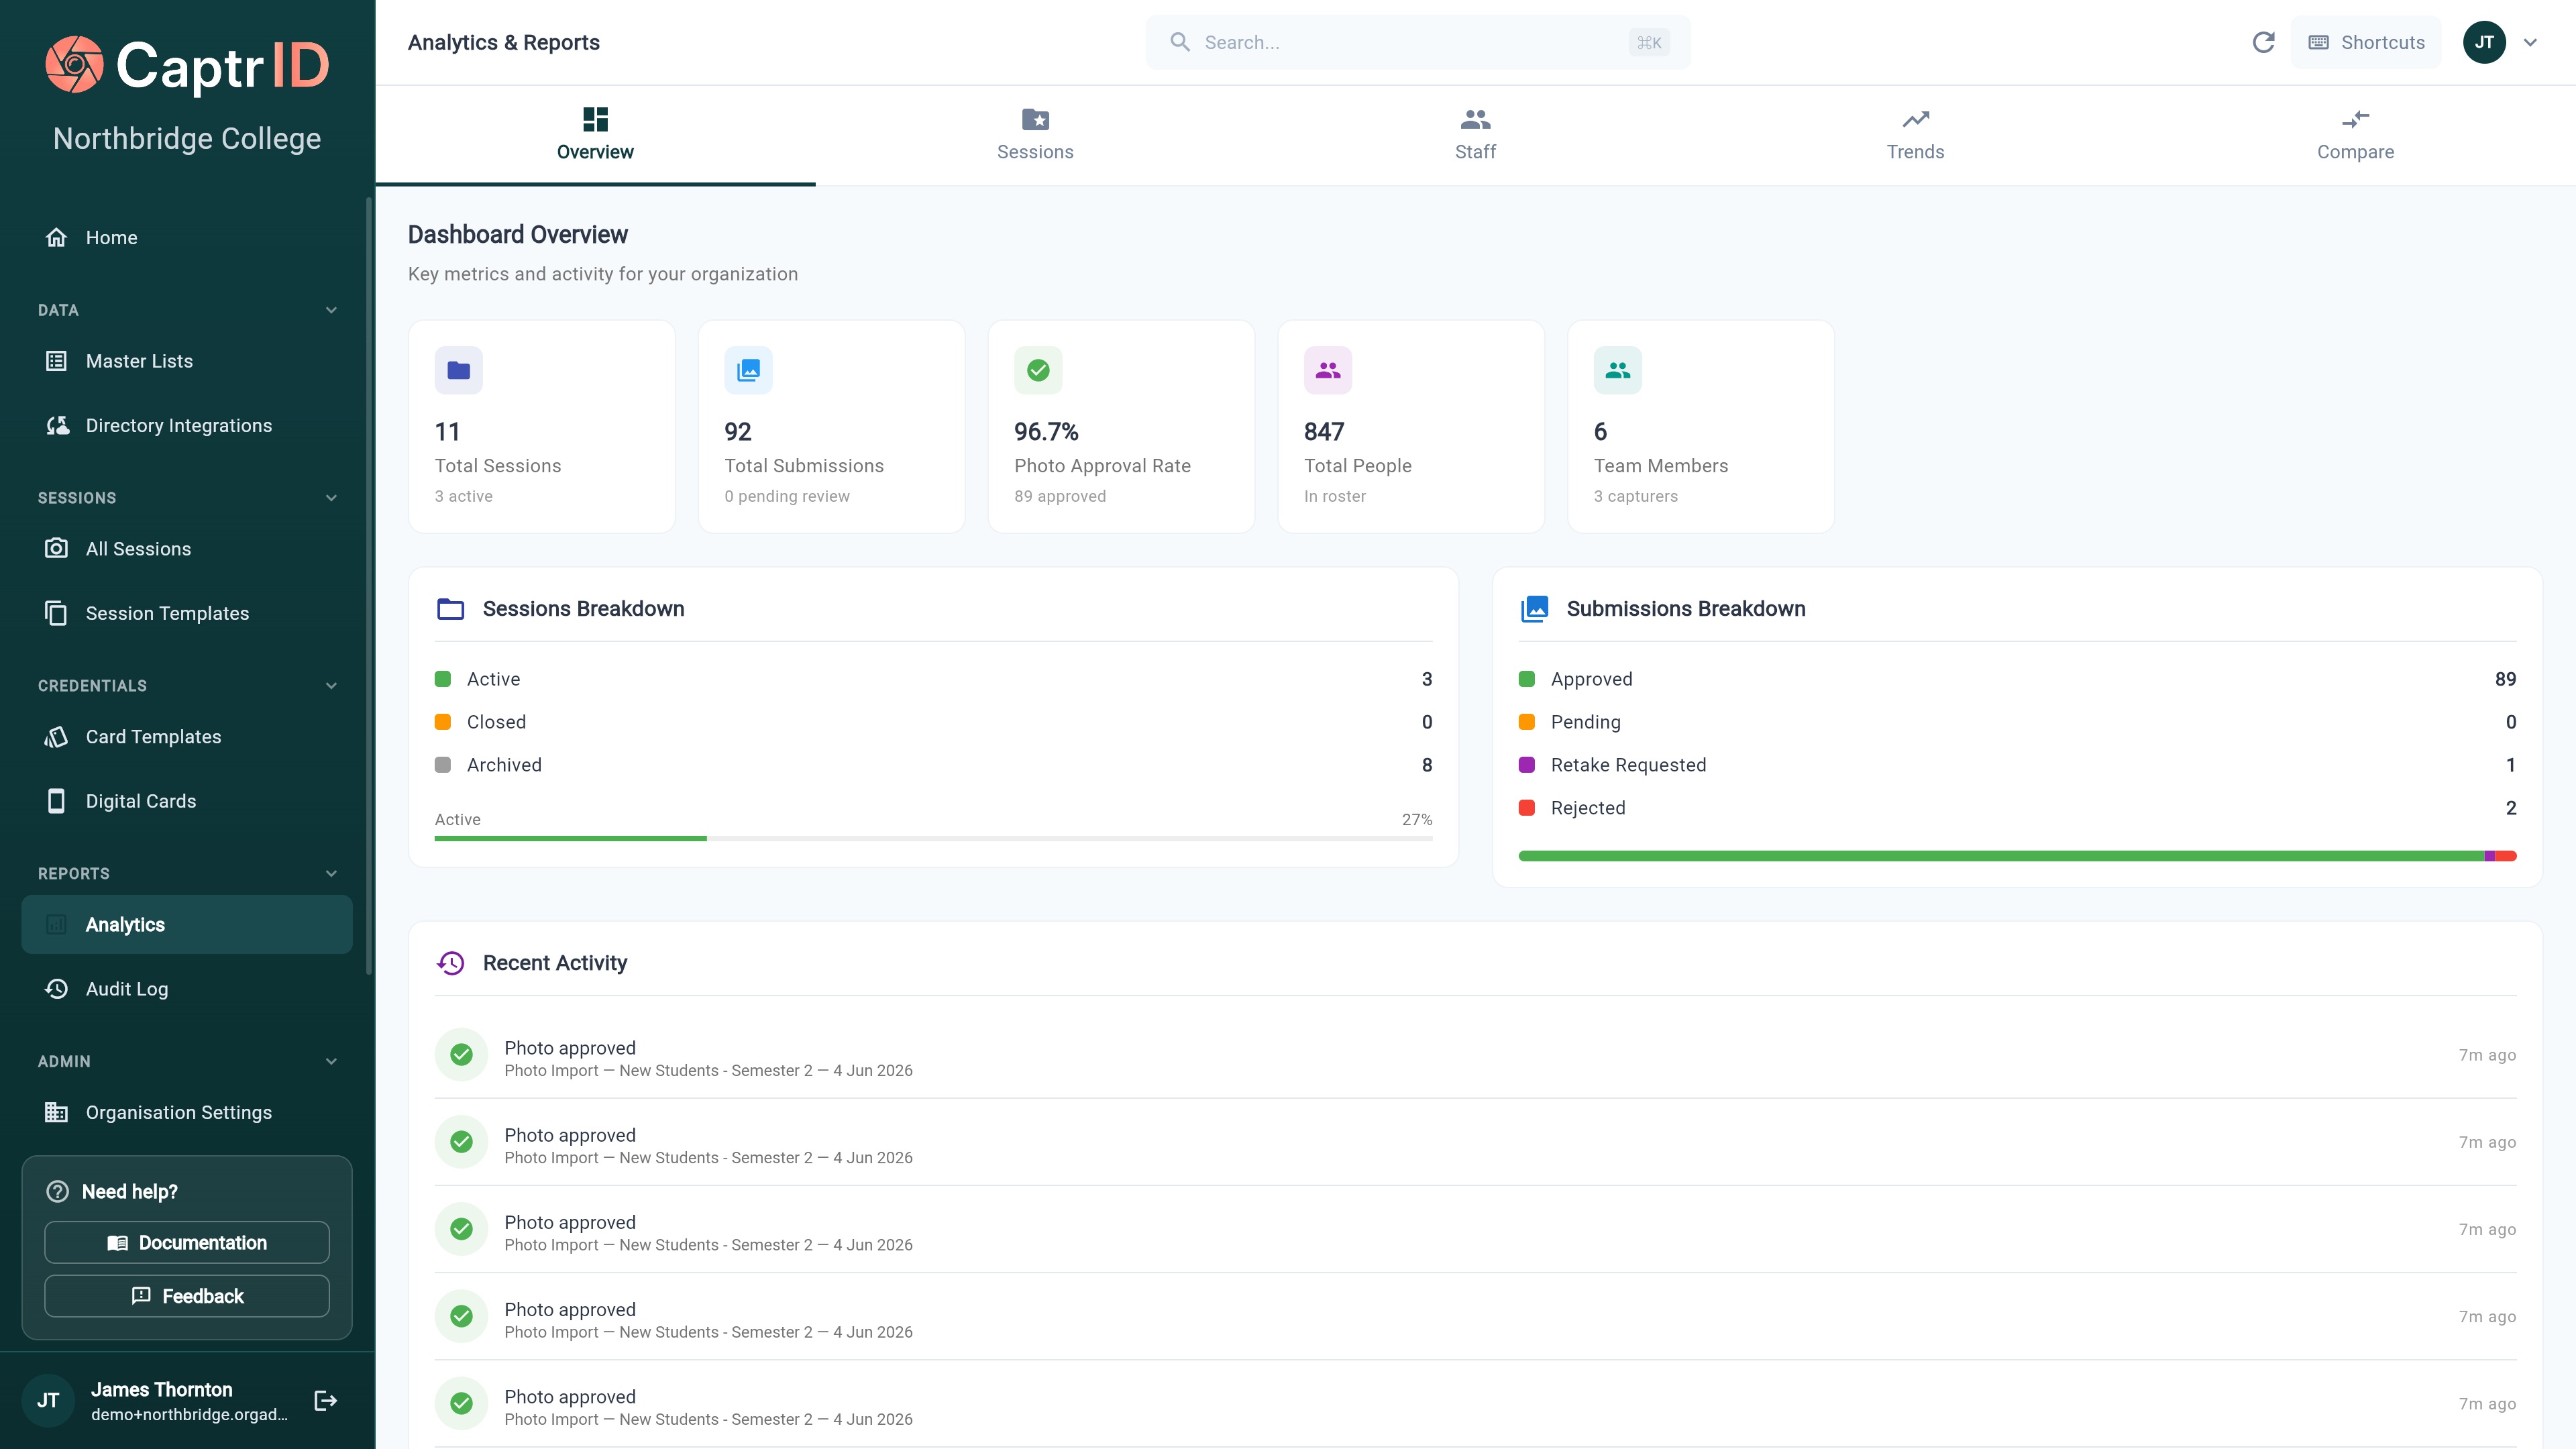
| Metric | What it shows |
|---|---|
| Total / Active / Closed / Archived Sessions | Session counts by status |
| Total People | People across all sessions |
| Total Submissions | All photo submissions |
| Pending / Approved / Rejected / Retake | Submission counts by status |
| Approval Rate | Percentage of submissions approved |
| Admin Count / Capturer Count | Team size breakdown |
- Sessions breakdown — session counts by lifecycle stage
- Submissions breakdown — photo counts by status
- Recent activity — the last 20 submissions with status, session name, and timestamp
Sessions tab
Per-session performance cards showing:- Session name and status (Active, Closed, or Archived)
- Roster size — total people in the session
- Completion % — percentage of people with approved photos
- Photo approval % — percentage of submissions approved
- Status chips for approved, pending, rejected, and retake counts
- Progress bar showing completion at a glance
Staff tab
A table showing each team member’s contributions:| Column | What it shows |
|---|---|
| Team Member | Name, email, and avatar |
| Role | Organisation Admin, Coordinator, or Capturer |
| Captured | Number of photos submitted |
| Reviewed | Number of photos approved or rejected |
| Total | Combined actions |
Trends tab
Track submission volume over time:
- Select a time range — Last 7 days, 30 days, or 90 days
- View the daily submissions chart showing how many photos were submitted each day
- Check the trend statistics:
- Total submissions in the period
- Daily average
- Peak day (highest single-day count)
- Active days (days with at least one submission)
Compare Sessions tab
Compare two or more sessions side by side:- Select the sessions you want to compare
- View their stats in a comparison table — roster size, completion rate, approval rate, and submission counts
What’s next?
The Dashboard
Return to your home screen for a quick overview.
Exporting Data
Export session data as CSV, ZIP, or PDF.